


Cohort Analysis: Understanding Customer Behavior Over Time
Imagine spending thousands on customer acquisition, your signup numbers look fantastic, but three months later, those customers have vanished. Sound familiar?
Here's the thing most businesses miss – tracking overall metrics like "total active users" or "monthly revenue" is like trying to understand a movie by looking at a single screenshot. You see a moment, but you miss the story. Cohort analysis changes that. It lets you follow groups of customers through their entire journey with your brand, revealing exactly when they engage, when they drift away, and most importantly, why.
And in industries where customer retention makes or breaks profitability – like iGaming, SaaS, and online retail – cohort analysis is essential.
What Is Cohort Analysis, Really?

Cohort analysis is a method that groups customers who share a common characteristic or experience within a specific timeframe, then tracks how these groups behave over time. Instead of lumping all your customers into one giant pool, you're creating smaller groups – cohorts – that let you spot patterns you'd otherwise miss completely.
Think of it this way: If you launched a marketing campaign in January and another in March, cohort analysis lets you compare how customers from each campaign behave six months down the line. Did the January crew stick around longer? Did March customers spend more per transaction? These insights are gold.
The beauty of cohort analysis is that it reconstructs what happened, when it happened, to whom, and why. You're not guessing anymore – you're seeing the actual customer lifecycle unfold in front of you.
Why Cohort Analysis Beats Traditional Analytics

Traditional analytics give you the 30,000-foot view. Cohort analysis puts you in the pilot's seat.
Let's say your overall monthly purchase numbers are climbing. Great news, right? But cohort analysis might reveal that this growth is driven entirely by first-time buyers, while your older customer cohorts are actually purchasing less frequently than before. That's a retention problem disguised as a growth story, and you'd never catch it without cohort analysis.
Here's what cohort analysis helps you do that standard metrics can't:
Isolate the impact of specific changes. Roll out a new onboarding flow? Cohort analysis shows you exactly how it affected retention for users who experienced it versus those who didn't.
{{cta-banner}}
Measure true campaign quality. You can track not just how many customers a campaign brought in, but how long those customers actually stuck around and how much they spent.
Separate seasonal noise from real trends. Did December sales spike because of the holidays or because your new loyalty program actually works? Cohort analysis tells you.
Identify your most valuable customers early. By analyzing behavioral patterns within cohorts, you can spot which actions signal long-term value and encourage more users to take those actions.
The Two Main Types of Cohorts You Need to Know

Acquisition Cohorts: Following the Timeline
Acquisition cohorts group customers based on when they first interacted with your brand – when they signed up, made their first purchase, or downloaded your app. This is your starting point for understanding the customer lifecycle.
For example, you might create cohorts based on the month customers registered. Your "January 2024" cohort includes everyone who signed up that month, and you track how they behave over the next 6, 12, or 24 months.
Acquisition cohorts are perfect for:
- Tracking retention rates over time
- Comparing the quality of different marketing channels
- Understanding seasonal trends in customer behavior
- Measuring the long-term impact of product changes
Behavioral Cohorts: Understanding the Why
Behavioral cohorts group customers based on specific actions they take (or don't take) within your platform. These cohorts reveal which behaviors drive engagement, retention, and revenue.
Maybe you create a cohort of users who completed your tutorial within the first 24 hours. Or customers who made a second purchase within 30 days. Or players who activated three specific game features.
Behavioral cohorts help you:
- Identify which actions correlate with long-term retention
- Spot early warning signs of churn
- Understand what drives your power users
- Test hypotheses about user engagement
The real power comes from combining both types. Start with acquisition cohorts to see when users drop off, then use behavioral cohorts to understand why.
How to Actually Perform Cohort Analysis (Step by Step)

Ready to get your hands dirty? Here's how to run a cohort analysis that actually produces useful insights.
Step 1: Define Your Goal
Don't just pull up data because you can. Start with a specific question you want to answer.
Are you trying to:
- Reduce churn during the first 90 days?
- Increase repeat purchase rates?
- Compare retention across different acquisition channels?
- Measure the impact of a new feature?
Your goal determines everything else – which cohorts you create, what metrics you track, and how you interpret the results.
Step 2: Choose Your Cohort Type and Criteria
Based on your goal, decide how you'll group your customers.
For retention analysis, start with time-based acquisition cohorts (by signup month or first purchase date). For engagement questions, use behavioral cohorts based on specific actions.
Make sure your cohorts are:
- Large enough to reveal meaningful patterns (avoid cohorts with fewer than 50-100 users)
- Clearly defined with consistent criteria across all groups
- Relevant to the question you're trying to answer
Step 3: Select Your Metrics
Pick metrics that directly relate to your business goals. Common choices include:
- Retention rate: Percentage of users still active after X days/weeks/months
- Churn rate: Percentage of users who stopped using your product
- Revenue per cohort: Total or average revenue generated over time
- Engagement metrics: Login frequency, feature usage, session duration
- Customer lifetime value (LTV): Total value a customer brings over their entire relationship with your brand
Step 4: Choose Your Time Frame
Decide how long you'll track each cohort and at what intervals.
- Daily cohorts work for high-frequency products (food delivery, mobile games)
- Weekly cohorts suit moderate-use products (fitness apps, productivity tools)
- Monthly cohorts make sense for longer sales cycles (eCommerce, SaaS)
Match your tracking period to your customer lifecycle. If most customers make their second purchase within 60 days, track cohorts for at least 90 days.
Step 5: Collect and Organize Your Data
You need three key pieces of data:
- Customer identifier (user ID, email, etc.)
- Cohort assignment date (signup date, first purchase, etc.)
- Activity metrics for all subsequent time periods
Most analytics platforms can generate this automatically, but you can also build cohort tables in Excel or Google Sheets using pivot tables.
Step 6: Visualize and Analyze
Create a cohort table where:
- Each row represents a cohort
- Each column represents a time period after the cohort's starting point
- Cells show your chosen metric (retention %, revenue, etc.)
Use color coding to make patterns pop – green for high retention, red for concerning drop-offs.
Now comes the fun part: reading the data.
Horizontal analysis: Look across each row to see how a single cohort's behavior evolves over time. Where do they drop off? When do they stabilize?
Vertical analysis: Look down each column to compare different cohorts at the same point in their lifecycle. Are newer cohorts performing better or worse than older ones?
Diagonal analysis: Follow the diagonal to spot trends across cohorts regardless of their start date.
Step 7: Act on Your Insights
Data without action is just trivia. Based on what you learned:
- Adjust your onboarding flow to address early drop-off points
- Double down on marketing channels that bring higher-quality customers
- Create targeted campaigns to re-engage at-risk cohorts
- Iterate on features that drive long-term retention
Then measure the impact by comparing new cohorts to old ones. Cohort analysis is not a one-time project, but an ongoing feedback loop.
Common Mistakes That Sabotage Your Analysis

Even smart teams make these errors. Here's how to avoid them:
Comparing incomplete cohorts. Don't compare a 3-month-old cohort's Day 90 retention to a 6-month-old cohort's Day 90 retention. The older cohort has complete data; the newer one doesn't.
Making cohorts too small or too large. Tiny cohorts produce unreliable patterns. Massive cohorts hide important differences. Find the sweet spot where you have enough users to trust the data but enough specificity to spot trends.
Tracking without a clear question. Opening a cohort chart "just to see" leads nowhere useful. Always start with a hypothesis or decision you need to inform.
Ignoring data quality. If your event tracking is messy or dates are wrong, your cohorts will lie to you. Clean your data first.
Focusing only on averages. "Average retention" hides critical differences between acquisition channels, user segments, and time periods. Always dig deeper.
Drawing conclusions from small samples. One successful company in a 3-company cohort doesn't validate your strategy. Patterns need repetition to mean something.
Cohort Analysis for Customer Lifetime Value

One of the most powerful applications of cohort analysis is calculating customer lifetime value (LTV) with actual behavior data instead of guesses.
Here's the simplified approach:
First, calculate the average revenue per customer within each cohort. Track their purchases over time and divide total revenue by the number of customers in that cohort.
Next, determine the average customer lifetime by tracking how many time periods customers remain active. If your January cohort has 60% retention after 6 months and 40% after 12 months, you can estimate the average lifetime.
Then multiply: LTV = Average Revenue per Customer × Average Customer Lifetime.
For example, if customers in your March 2024 cohort spend ₹1,000 on average and stick around for 1.8 years, their LTV is ₹1,800.
But cohort analysis takes this further. You can:
- Compare LTV across different acquisition channels to optimize your marketing spend
- Identify which early behaviors correlate with higher LTV
- Segment cohorts by demographics or product preferences to personalize experiences
- Calculate LTV trends over time to see if your retention efforts are working
Using Cohort Analysis to Reduce Churn

Churn is expensive. Acquiring a new customer costs 5-25 times more than retaining an existing one. Cohort analysis gives you the roadmap to keep customers around.
Start by creating acquisition cohorts to identify when most churn happens. Do customers drop off after the first week? After the free trial ends? After three months?
Once you know when, create behavioral cohorts to understand why. Compare users who churned to those who stayed. What did the stayers do differently?
Maybe customers who connected their account to a third-party service within 7 days have 67% higher retention. Or users who engage with three specific features are half as likely to churn. These insights tell you exactly where to focus your retention efforts.
Then take action:
- Redesign onboarding to guide users toward high-retention behaviors
- Send targeted campaigns to at-risk cohorts before they churn
- Offer personalized incentives based on cohort behavior patterns
- Test interventions and measure impact on subsequent cohorts
Smartico.ai: Where Cohort Insights Meet Action
Understanding customer behavior through cohort analysis is powerful. But turning those insights into personalized experiences that drive retention? That's where Smartico.ai comes in.
Smartico.ai is the first unified CRM automation and gamification platform built specifically for the iGaming industry, though its capabilities extend to any business focused on customer engagement and retention. Founded 2019, Smartico combines real-time gamification mechanics with sophisticated CRM automation to turn cohort insights into automated, personalized player experiences.
Here's how Smartico transforms cohort analysis from insight to impact:
Behavior-based automation lets you trigger personalized campaigns based on the exact actions that your cohort analysis reveals matter most. If your analysis shows that users who complete a specific mission within 48 hours have 3x higher retention, Smartico can automatically guide new users toward that action.
Dynamic segmentation uses your cohort criteria to create personalized journeys in real-time. Players aren't just grouped – they receive tailored rewards, missions, and communications based on their cohort membership and behavior patterns.
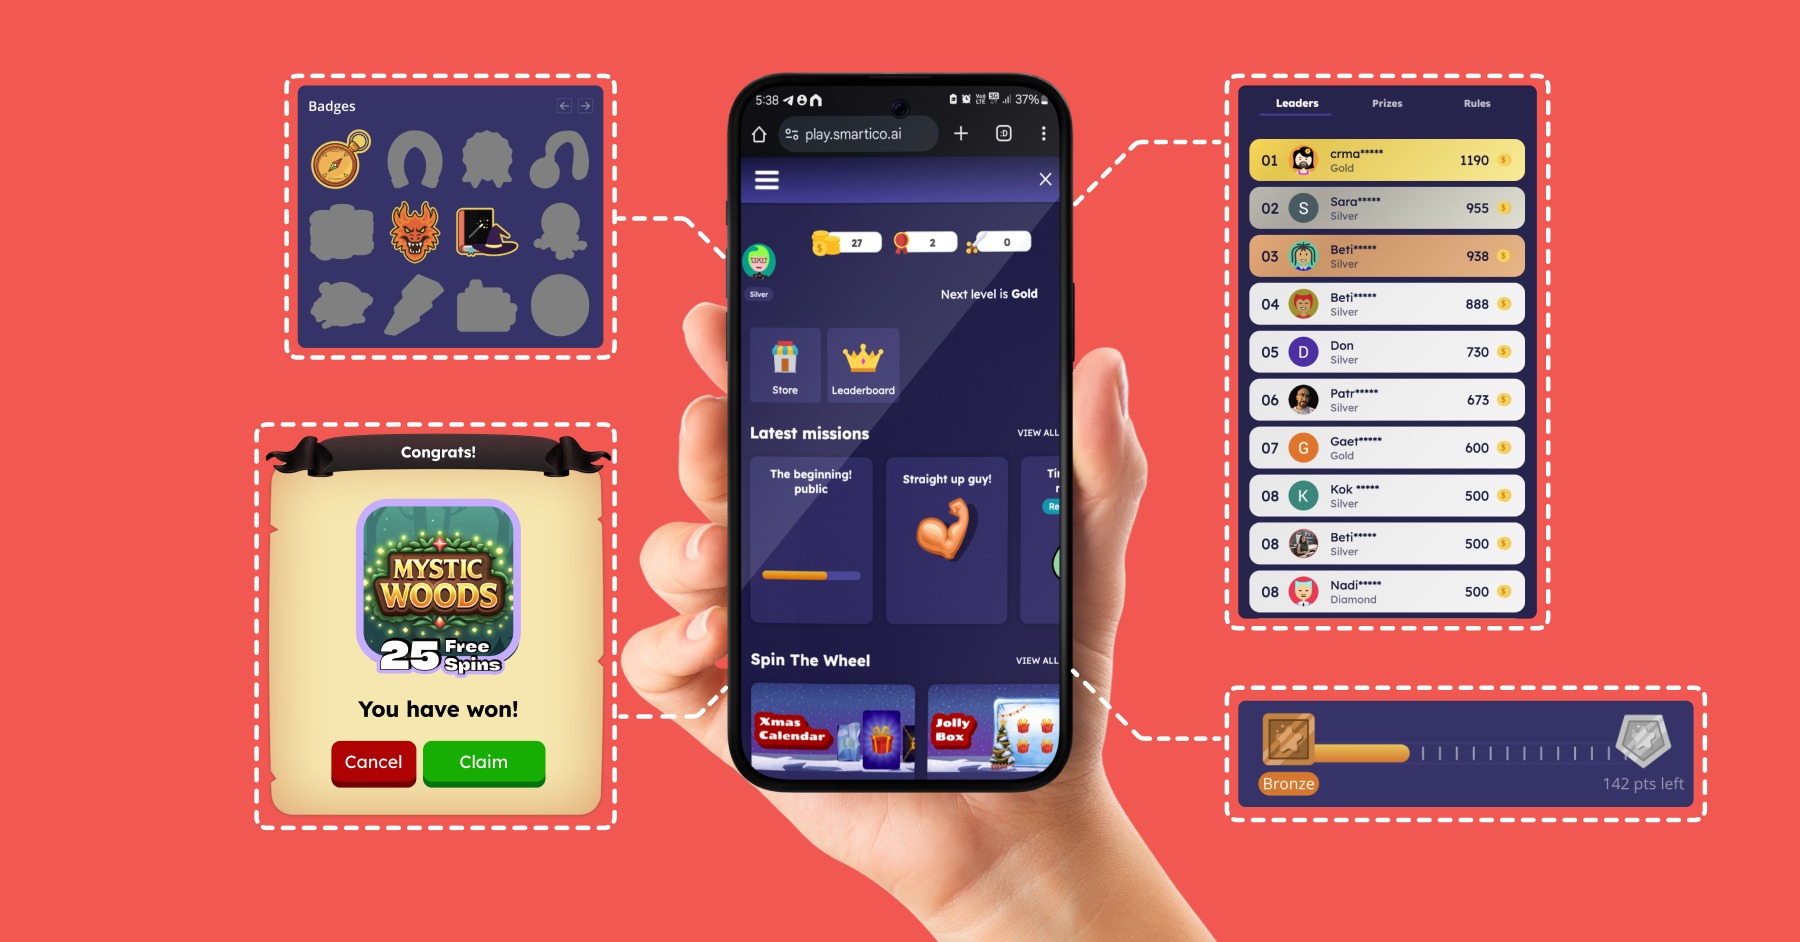
Gamification mechanics turn retention strategies into engaging experiences. Points, levels, missions, tournaments, and leaderboards keep players coming back, while your cohort data ensures these elements target the behaviors that actually drive long-term value.
Real-time CRM campaigns let you reach cohorts at the perfect moment. If your analysis shows that Day 7 is critical for retention, Smartico can automatically trigger personalized outreach on Day 6 with offers designed specifically for that cohort.
Predictive AI models take cohort analysis to the next level by identifying churn risk before it happens and automating preventive actions.
The beauty of Smartico is that it closes the loop between analysis and action. You identify the patterns through cohort analysis, and Smartico automates the personalized responses at scale – across email, SMS, push notifications, and in-platform messaging.
Want to find out how Smartico can help your business specifically raise retention and revenue? Book your free, in-depth demo below.
{{cta-banner}}
Retention Marketing Strategies Powered by Cohort Data

Armed with cohort insights, you can craft retention strategies that actually work.
Personalized loyalty programs become dramatically more effective when you tailor rewards based on cohort behavior. If your analysis shows that early repeat purchasers have 4x higher LTV, create special incentives to encourage that second purchase within your target timeframe.
Gamification elements should align with what your high-retention cohorts naturally do. Design challenges, progress bars, and achievement systems around the behaviors that correlate with loyalty.
Lifecycle campaigns can target specific cohort milestones. Send a personalized offer on Day 30 to cohorts that typically churn around Day 35. Celebrate the 90-day anniversary with cohorts that show strong retention at that point.
Win-back campaigns become surgical when you know exactly which cohorts are at risk and when. Instead of blasting everyone who hasn't logged in for 30 days, target specific behavioral cohorts with messages that address their specific usage patterns.
Omnichannel engagement ensures you reach customers through their preferred channels, informed by cohort preferences. If your mobile app cohorts engage differently than web cohorts, your messaging should reflect that.
Tools for Cohort Analysis

You don't need a data science degree to run cohort analysis anymore. Here are your options:
Google Analytics 4 offers built-in cohort reports perfect for tracking website and app behavior. It's free and surprisingly powerful for basic cohort analysis.
Amplitude and Mixpanel are product analytics platforms built for sophisticated cohort analysis, with robust segmentation and retention tracking. They're ideal for mobile apps and SaaS products.
Heap Analytics automatically captures user events, making cohort creation nearly effortless.
Matomo provides privacy-focused cohort analysis with full data ownership and unlimited cohort creation.
Excel or Google Sheets work great for basic cohort tables if you can export your data. Several templates are available online to get you started.
Smartico.ai not only helps analyze cohorts but automatically acts on those insights through personalized gamification and CRM automation.
Choose based on your needs: simple retention tracking versus deep behavioral analysis, privacy requirements, integration capabilities, and whether you need automation alongside analytics.
FAQ
1. What's the difference between cohort analysis and segmentation?
Segmentation groups customers by static attributes like age or location. Cohort analysis groups customers by shared experiences or behaviors and tracks how they change over time. Segmentation is a snapshot; cohort analysis is a movie. You can combine both by analyzing cohorts within specific segments for even deeper insights.
2. How long should I track a cohort before drawing conclusions?
It depends on your customer lifecycle. For high-frequency products, two weeks might be enough. For longer sales cycles, track cohorts for at least 6-12 months. A good rule: track cohorts long enough to see at least one complete purchasing cycle plus 30%.
3. Can cohort analysis work for B2B companies?
Sure. B2B companies can create cohorts based on signup date, contract start date, onboarding completion, or first value milestone. The principles are identical – you're still tracking groups of customers through their journey to understand retention, expansion, and churn patterns.
4. What's a good retention rate for my cohorts?
This varies wildly by industry. SaaS companies might aim for 90%+ retention after 12 months. eCommerce brands might consider 35% repeat purchase rate within 6 months as strong. The key is comparing your cohorts to each other and tracking whether retention improves over time as you iterate on your product and strategies.
5. How often should I run cohort analysis?
For fast-moving businesses, review cohorts weekly or monthly. For slower cycles, quarterly reviews work fine. The important thing is consistency – pick a cadence and stick with it so you can spot trends early. Automated tools like Smartico.ai make continuous cohort monitoring effortless.
6. What's the biggest mistake businesses make with cohort analysis?
Looking at data without acting on it. Cohort analysis should drive decisions – changes to onboarding, targeted retention campaigns, product iterations, or marketing reallocation. If you're not using insights to change behavior, you're just making pretty charts.
Cohort analysis transforms how you understand your customers. Instead of guessing why people stay or leave, you see the patterns unfold in real data. You spot problems early, identify what actually drives retention, and focus your efforts where they matter most.
The businesses that win aren't necessarily the ones acquiring the most customers, but the ones keeping them. And cohort analysis gives you the blueprint to do exactly that.
Ready to turn your cohort insights into personalized experiences that boost retention? Request a demo of Smartico.ai and see how unified CRM automation and gamification can transform your customer engagement strategy.
Did you find this article helpful? If so, consider sharing it with other industry professionals such as yourself.
Ready to use Smartico?
Join hundreds of businesses worldwide engaging players with Smartico.