


Interactive Calculator: Predict ROI of AI-Gamified Workflows

You don't need to wonder whether gamification works anymore. You can calculate it.
Most businesses spend money on customer engagement without knowing what they'll get back. This interactive calculator shows you exactly how AI-powered gamification can boost your monthly active users, cut churn rates, and deliver returns that make financial sense.
Why Your Current Retention Strategy Falls Short
Here's what the data tells us: traditional customer retention methods aren't keeping up. Studies show that 55% of iGaming players leave within a year, while most businesses face churn rates between 20-30%. Generic bonuses and standard reward programs can't compete in today's crowded market.
Companies using AI-driven gamification see different outcomes. They report churn reduction of up to 35% and engagement increases of 67%. The difference comes from strategy backed by behavioral science and powered by smart technology.
The Psychology Behind Gamification Returns
Gamification touches on how people naturally think and behave. When you add game mechanics like progress tracking, achievements, and personalized challenges to your platform, users engage more deeply and stick around longer.
Gamified platforms can boost retention rates by up to 50% while increasing customer lifetime value by 3x to 10x. The real power comes when AI personalizes these experiences. Instead of generic point systems, modern gamification platforms analyze user behavior patterns and deliver targeted challenges that match individual preferences and playing styles.
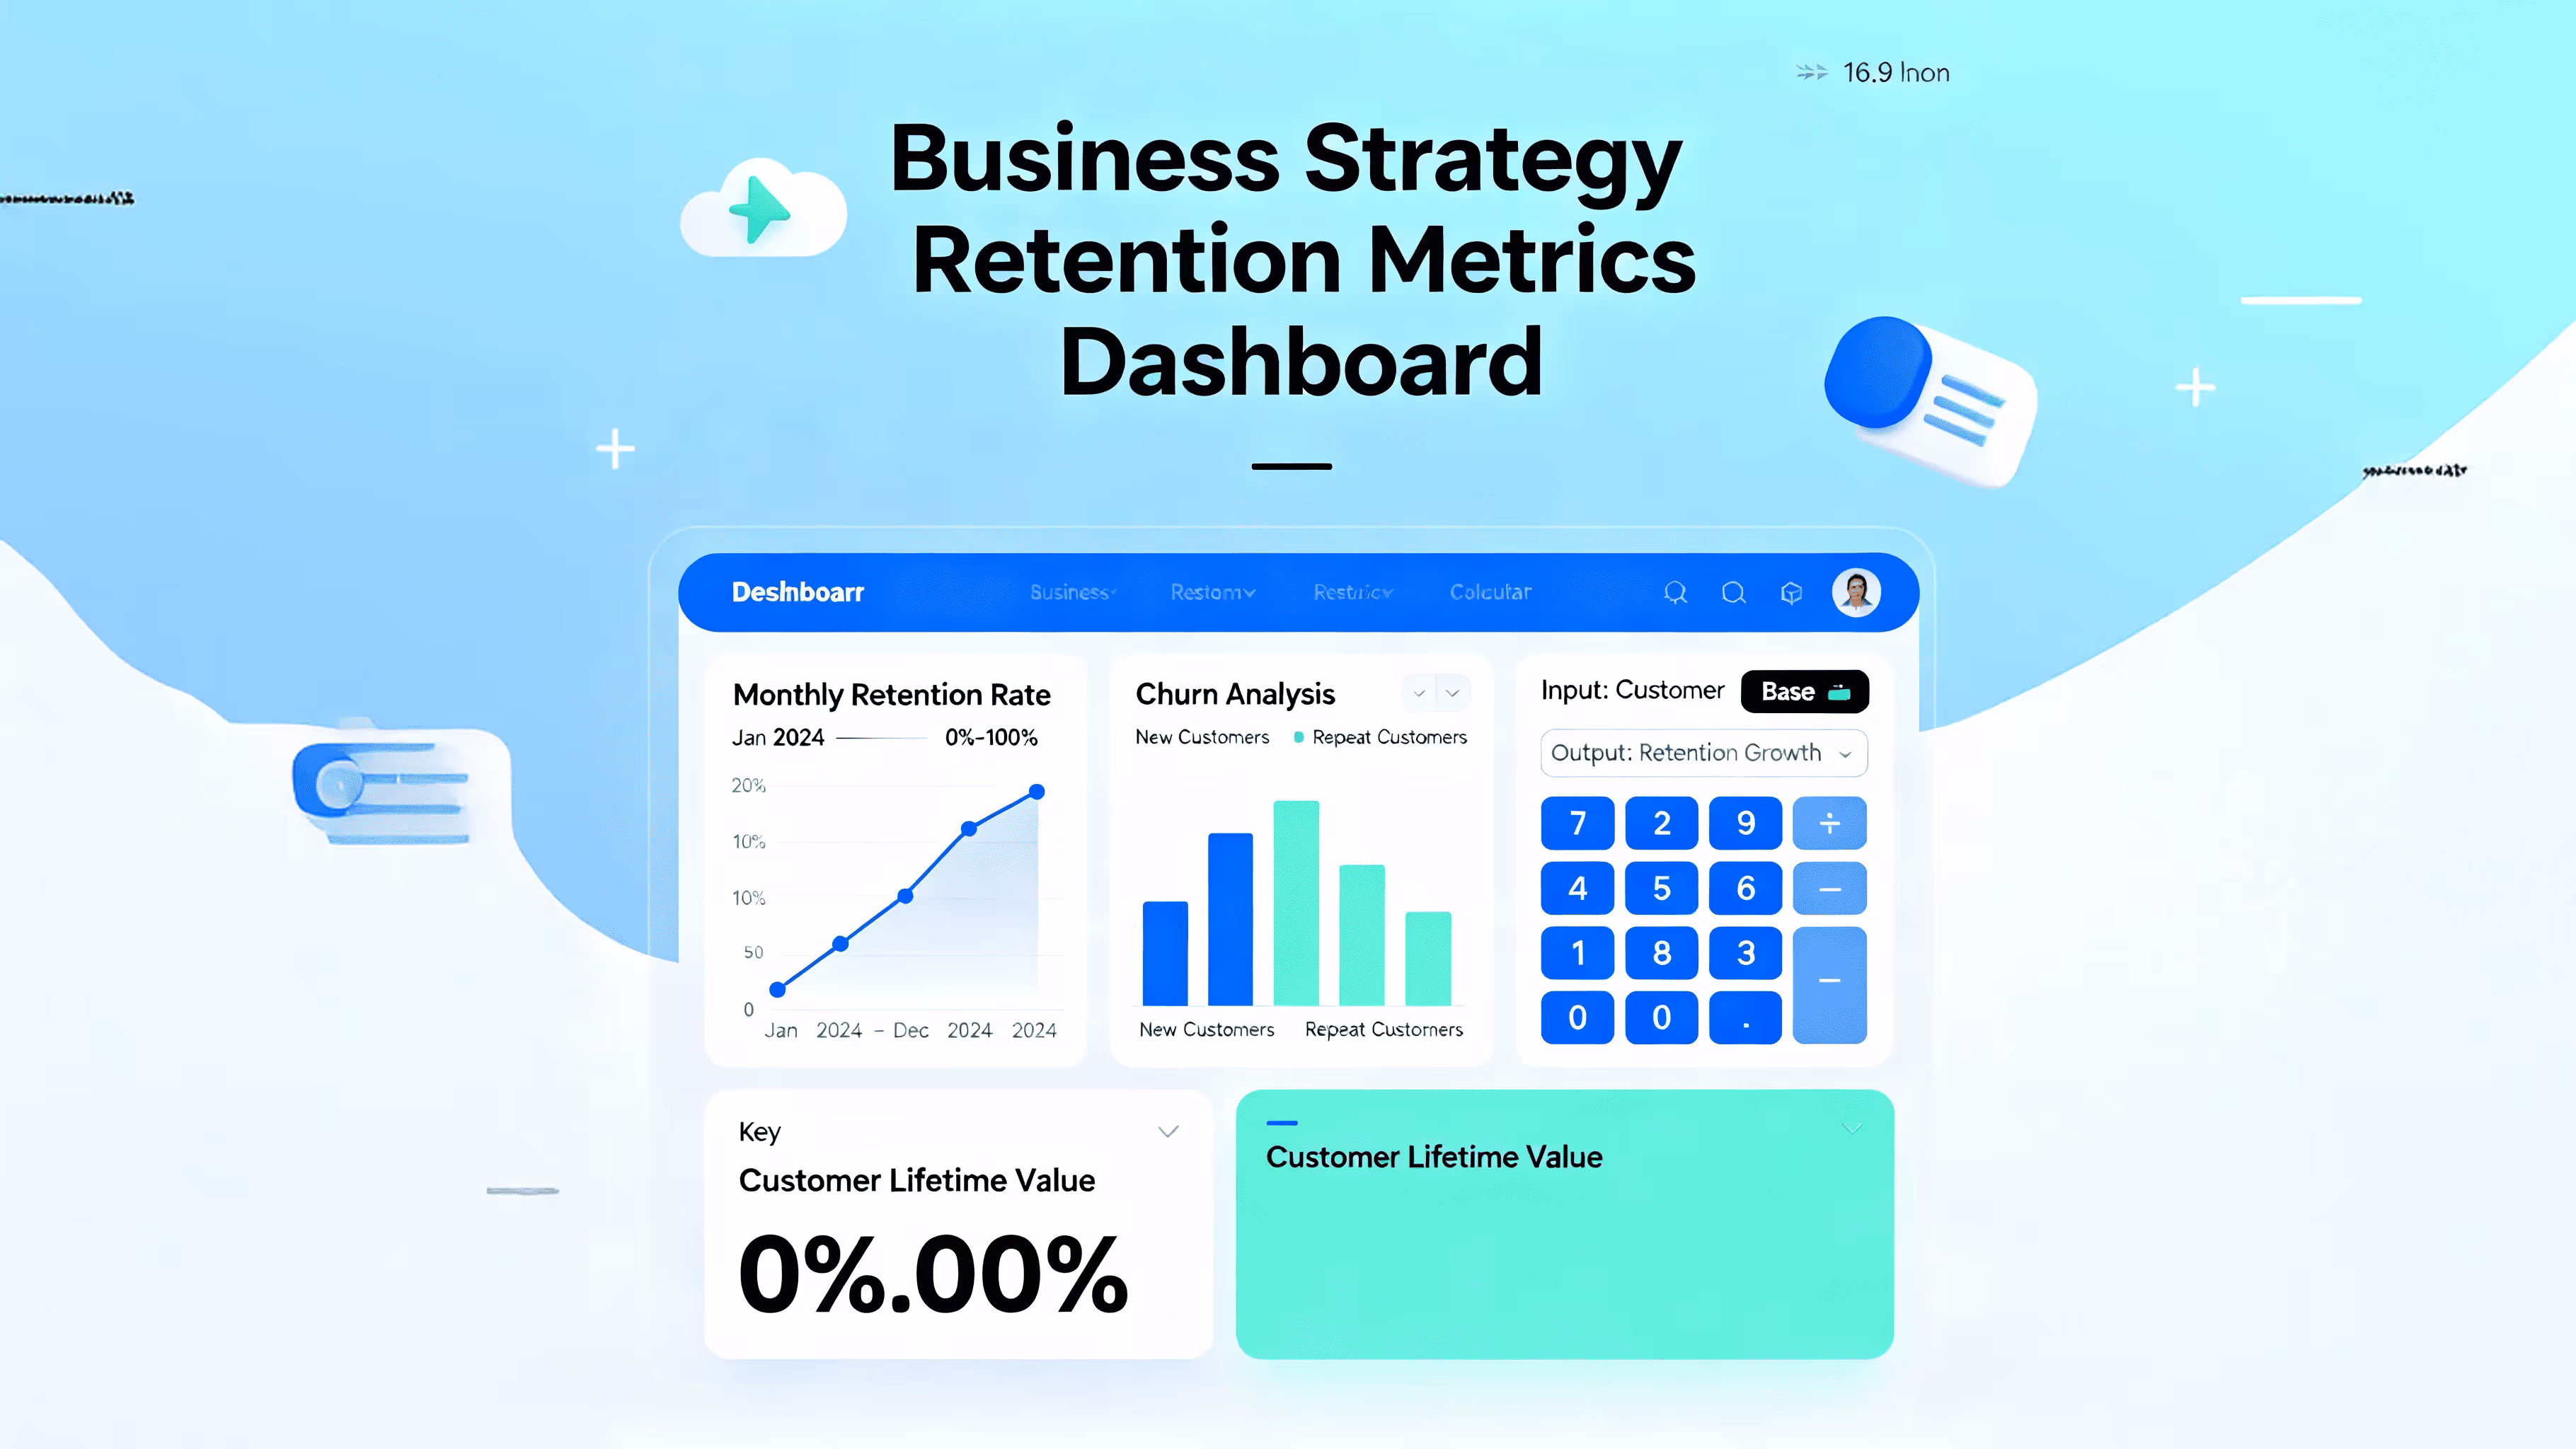
How the ROI Calculator Functions

Our calculator uses real industry data to project your gamification returns. Input three key metrics, Monthly Active Users (MAU), current churn rate, and bonus costs per user, and the calculator reveals your potential transformation.
The tool factors in proven improvement benchmarks:
- 35% reduction in churn rates (based on successful implementations)
- 25% increase in user engagement (from behavioral psychology research)
- 15% uplift in revenue per user (through enhanced monetization)
{{cta-banner}}
These numbers come from aggregated data across thousands of gamified platforms in industries like iGaming, fintech, and e-commerce.
Understanding Your Break-Even Timeline

Most gamification investments pay for themselves quicker than expected. The calculator shows exactly when you'll hit break-even based on your specific metrics.
For a platform with 50,000 MAU, 25% churn, and $5.50 monthly bonus costs per user, gamification typically breaks even in 2.4 months. Annual net benefits often reach $7.2 million with ROI exceeding 4,800%.
Smaller platforms see proportional returns. A 10,000 MAU platform might generate $1.4 million in annual benefits with 971% ROI. The math scales in both directions – larger platforms can see returns in the tens of millions.
Real-World Performance Data

The numbers paint a clear picture. Platforms implementing AI-gamification see immediate impact across key performance indicators:
User Engagement: Session length increases by an average of 25-40% as players pursue achievements and compete on leaderboards.
Revenue Growth: Average revenue per user typically rises 15-30% through improved monetization and reduced price sensitivity.
Operational Efficiency: Automated gamification reduces manual bonus management costs while increasing program effectiveness.
Customer Satisfaction: Net Promoter Scores improve as users find more value and enjoyment in their platform experience.
The MAU Factor: Scale Drives Returns

Monthly Active Users serve as the foundation for gamification ROI. The calculator demonstrates how MAU size directly impacts your potential returns.
Platforms with higher MAU see accelerated break-even periods because fixed gamification costs spread across more users. A 200,000 MAU platform might break even in just 0.1 months compared to 1.2 months for a 10,000 MAU platform.
Smaller user bases shouldn't discourage you. Even modest platforms generate substantial returns when gamification reduces churn and boosts engagement. The key is matching your investment level to your user base size and growth trajectory.
Beyond the Numbers: Additional Value Creation

ROI calculations capture financial returns, but gamification creates additional value that's harder to measure:
Brand Differentiation: Engaging experiences separate your platform from competitors using standard reward systems.
User-Generated Content: Gamified social features encourage sharing and organic marketing that reduces acquisition costs.
Data Intelligence: Game mechanics generate rich behavioral data that improves personalization and product development.
Team Productivity: Internal gamification can boost employee performance by 48% and reduce training costs.
Common ROI Calculation Errors

Many businesses underestimate gamification ROI because they focus on surface metrics instead of deeper behavioral changes.
Error 1: Measuring only immediate engagement instead of long-term retention patterns.
Error 2: Ignoring the compound effect of reduced churn on customer lifetime value calculations.
Error 3: Failing to account for operational cost savings from automated reward systems.
Error 4: Undervaluing the competitive advantage that engaged, loyal users provide.
Smart businesses track both quantitative metrics (revenue, churn, session time) and qualitative indicators (satisfaction scores, feature adoption, social sharing).
Advanced Calculator Features

The calculator goes beyond basic ROI to show scenario planning across different improvement levels. Adjust the expected churn reduction from conservative (20%) to aggressive (50%) and see how it impacts your returns.
You can model different bonus cost structures too. Some platforms reduce bonus costs through gamification by replacing expensive cash rewards with achievement-based recognition systems. Others invest more in rewards but see higher user lifetime values that justify the spending.
The break-even analysis helps with budgeting and timeline planning. Finance teams appreciate seeing exactly when investments start generating positive returns, especially for quarterly planning cycles.
Industry-Specific Applications
iGaming Platforms: Focus on reducing the 55% annual churn rate through personalized tournaments and achievement systems. Revenue uplifts typically exceed 20% due to increased session frequency.
E-commerce: Gamified loyalty programs boost repeat purchase rates by 25-35% while reducing customer acquisition costs through referral mechanics.
SaaS Applications: Onboarding gamification can reduce early churn by 70% while feature adoption gamification increases user engagement by 40%.
Fintech: Gamified savings and investment features see 700% conversion rate improvements and stronger customer retention than traditional financial products.
Implementation Timeline and Investment

Modern gamification platforms integrate more quickly compared to custom development. Most implementations take 4-8 weeks from setup to launch, with additional time for optimization and testing.
Cost structures vary by platform complexity and user base size. Enterprise solutions typically start around $50,000-150,000 annually but scale efficiently as MAU grows. The calculator helps determine whether your projected returns justify different pricing tiers.
Factor in ongoing costs like bonus pool funding, creative asset development, and platform maintenance for accurate ROI projections.
Measuring Success Beyond ROI

While ROI provides crucial financial validation, track additional metrics to ensure gamification delivers comprehensive value:
User Stickiness Ratio: Daily Active Users divided by Monthly Active Users shows how frequently people engage.
Feature Adoption Rates: Monitor which gamified elements drive the most engagement and retention.
Social Amplification: Track sharing, referrals, and community activity generated by game mechanics.
Support Ticket Reduction: Well-designed gamification often reduces customer service burden through self-service engagement.
Getting Started: Your Action Plan
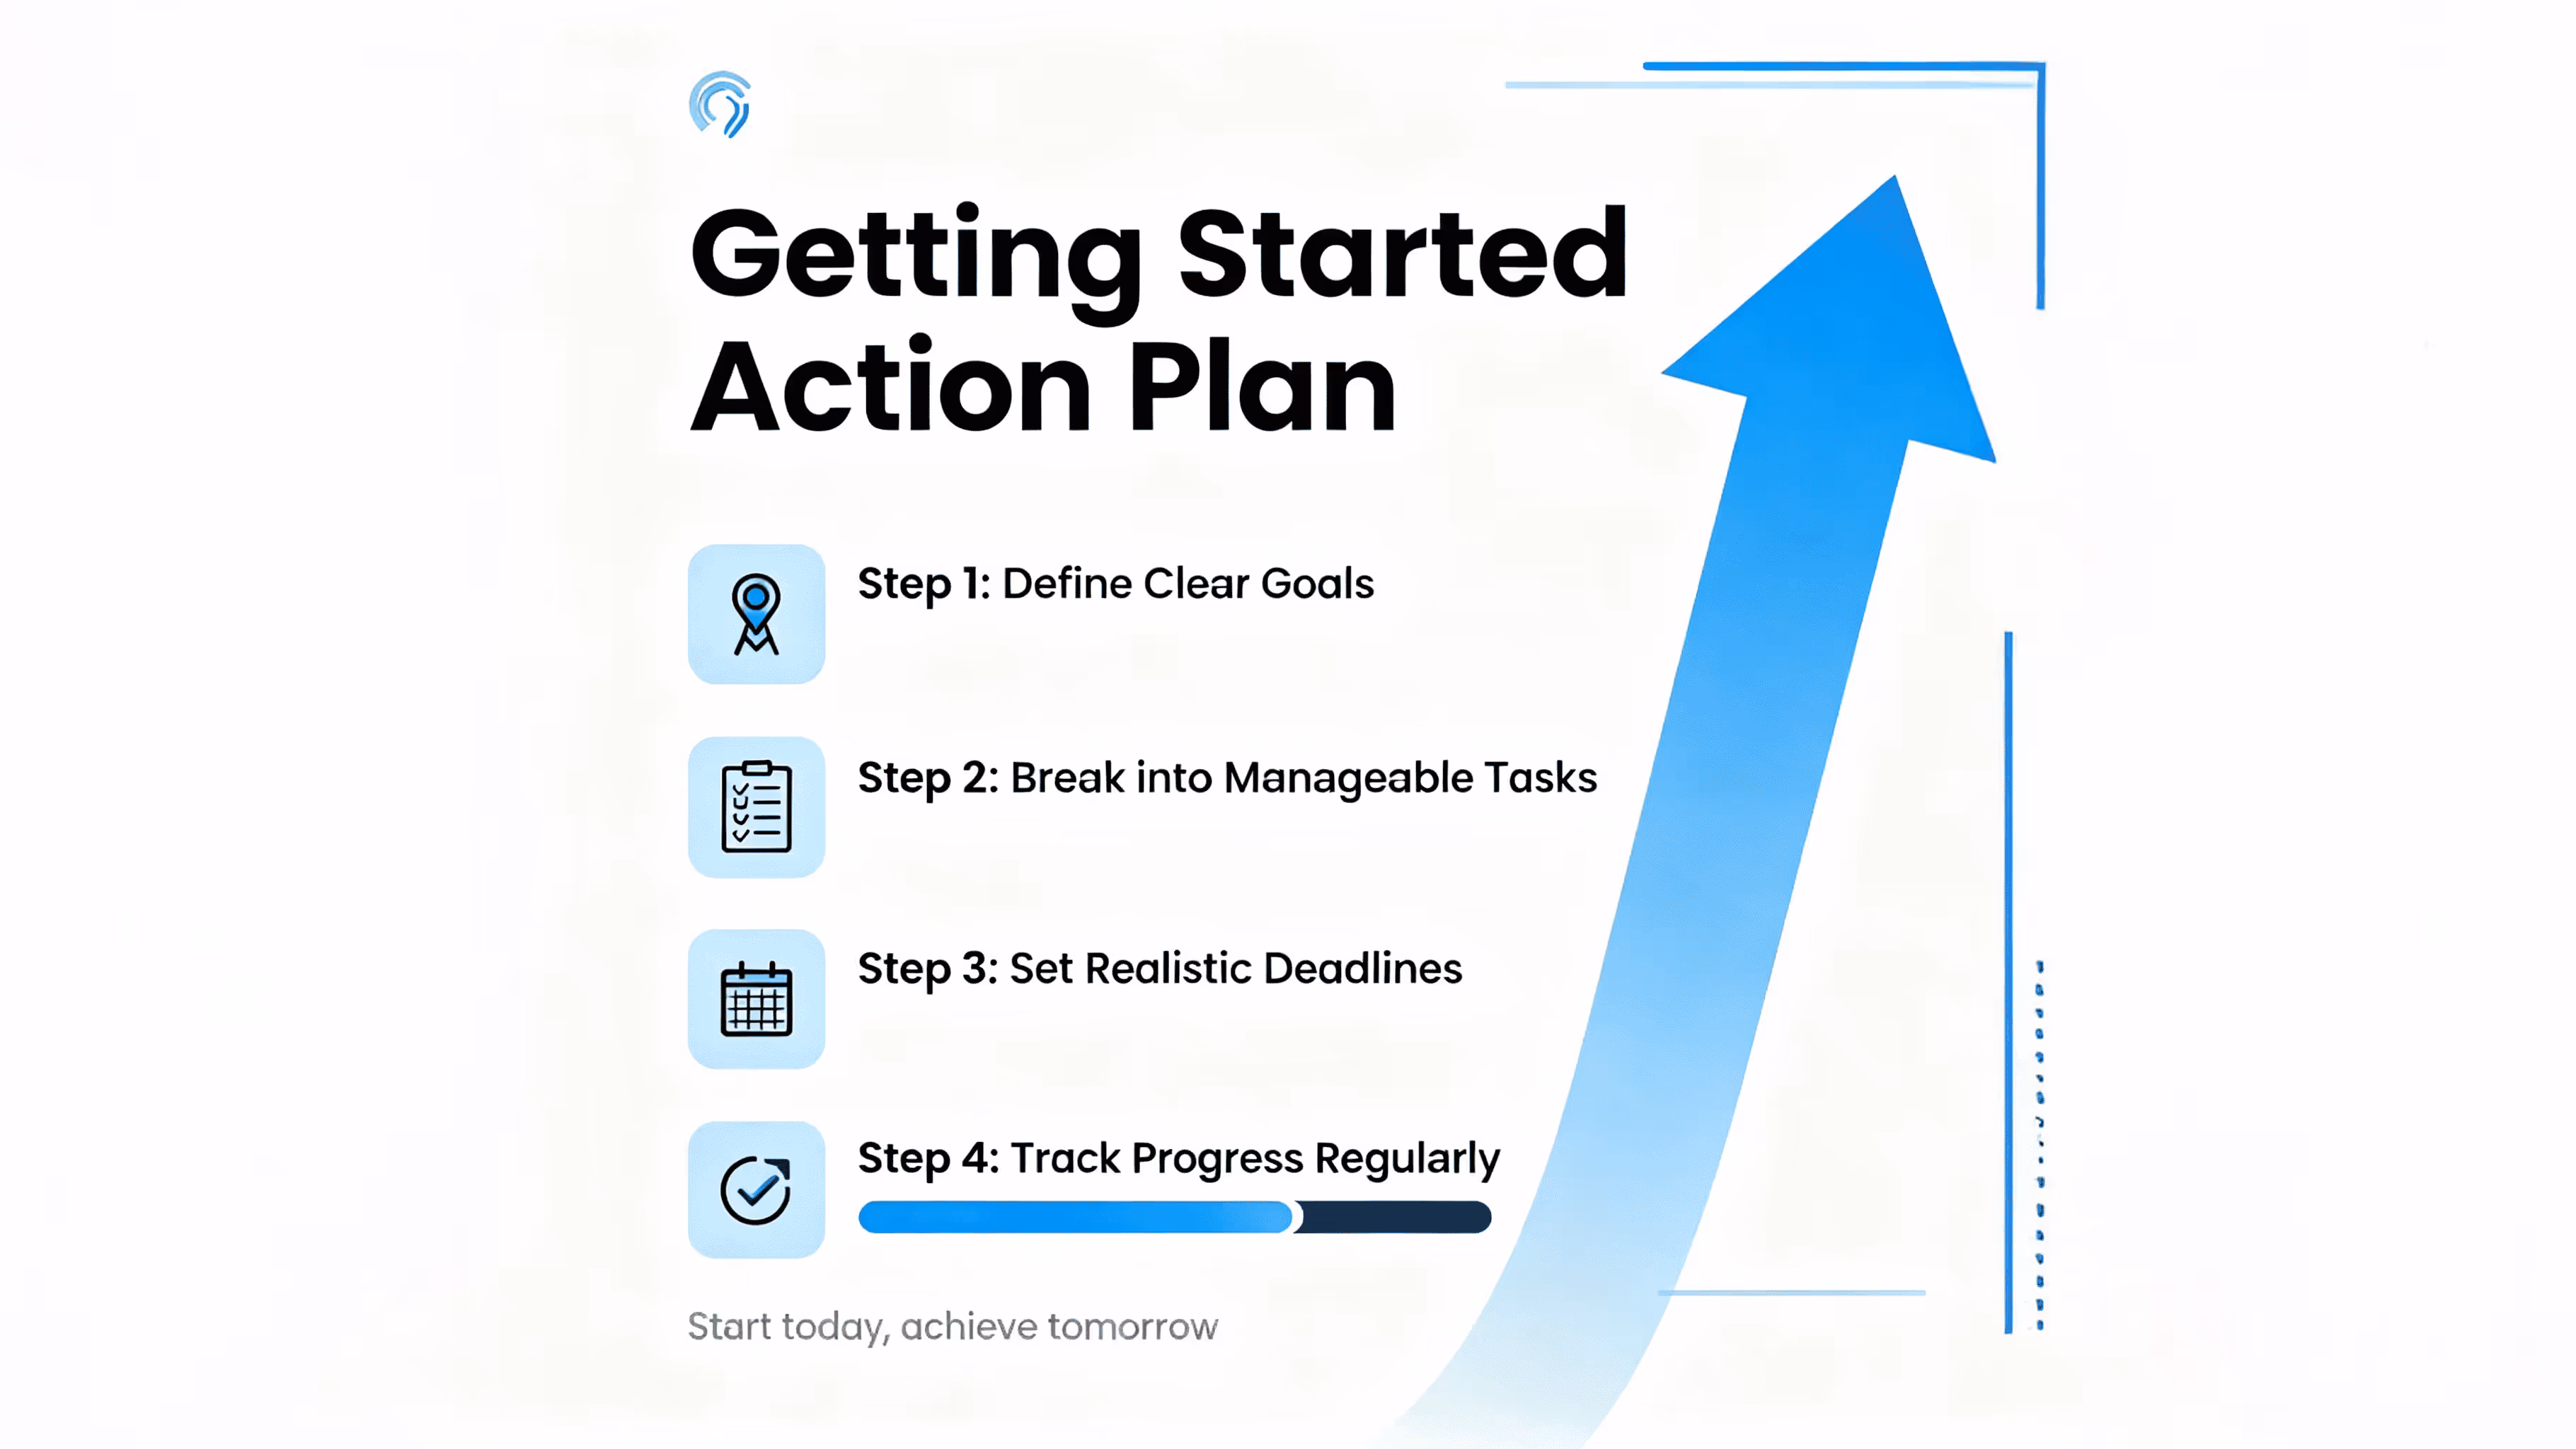
Ready to transform your platform with AI-powered gamification? The calculator provides your baseline projections, but implementation requires strategic planning.
Start by auditing your current user engagement patterns and identifying your biggest retention challenges. Map out which game mechanics would resonate most with your audience – competitive leaderboards for some, collaborative challenges for others.
Consider running pilot programs with small user segments before full deployment. This approach validates your assumptions and fine-tunes the experience before major investment.
About Smartico.ai: Unified Gamification Excellence
Smartico.ai stands as the industry's first and leading unified Gamification/CRM Automation software, transforming how businesses engage and retain customers. Since 2018, this comprehensive platform has revolutionized customer relationship management by integrating advanced gamification mechanics with powerful CRM automation tools.
The platform specializes in creating personalized, AI-driven experiences that boost customer engagement and maximize retention across multiple industries. From loyalty wheels and scratch cards to sophisticated jackpot engines and behavioral analytics, Smartico.ai provides everything needed to gamify customer interactions without requiring third-party integrations.
What sets Smartico.ai apart is its unified approach, combining gamification, CRM automation, affiliate management, and real-time personalization in a single, scalable solution. With massive proven success, the platform delivers measurable ROI improvements that often overdeliver within the first year of implementation.
To find out how Smartico can help grow your business revenue specifically, book your free, in-depth demo below.
{{cta-banner}}
FAQ

How accurate are the ROI projections from the calculator?
The calculator uses industry benchmarks from successful gamification implementations across thousands of platforms. While individual results vary based on execution quality and market conditions, the improvement factors (35% churn reduction, 25% engagement increase) represent conservative estimates from peer-reviewed studies and case analysis.
What's the minimum MAU needed to justify gamification investment?
Platforms with as few as 5,000 MAU can see positive ROI, especially if they have high revenue per user or significant churn problems. The key is matching your investment level to your user base size and selecting features that deliver maximum impact per dollar spent.
How long does it take to see results after implementing gamification?
Most platforms see initial engagement improvements within 2-4 weeks of launch. Significant churn reduction typically becomes measurable after 60-90 days as user behavior patterns stabilize. Full ROI realization often occurs within 6-12 months depending on implementation scope.
Can gamification work for B2B platforms or is it only for consumer applications?
B2B gamification shows excellent results, particularly for software adoption, training programs, and sales performance. Enterprise platforms often see 40-48% productivity improvements and reduced onboarding costs. The psychology of achievement and progress tracking applies across all user types.
What happens if users get tired of the gamification elements?
Well-designed gamification evolves with user preferences through AI-powered personalization and regular content updates. Platforms that refresh challenges, introduce seasonal events, and adapt reward structures based on behavioral data maintain long-term engagement. The key is avoiding static, repetitive game mechanics.
Conclusion
The gamification ROI calculator reveals what data-driven businesses already understand: engagement is all about sustainable revenue growth. When you reduce churn by 35% and boost revenue per user by 15%, the result is measurable profit acceleration.
Move beyond generic retention strategies that drain budgets without delivering results. Use data-driven gamification to transform your platform into an engagement engine that users enjoy and finance teams support. The calculator shows the potential – now it's time to build it.
Did you find this article helpful? If so, consider sharing it with other industry professionals such as yourself.
Ready to use Smartico?
Join hundreds of businesses worldwide engaging players with Smartico.