iPhone vs Android Players: iPhone Players Deposit 64% More
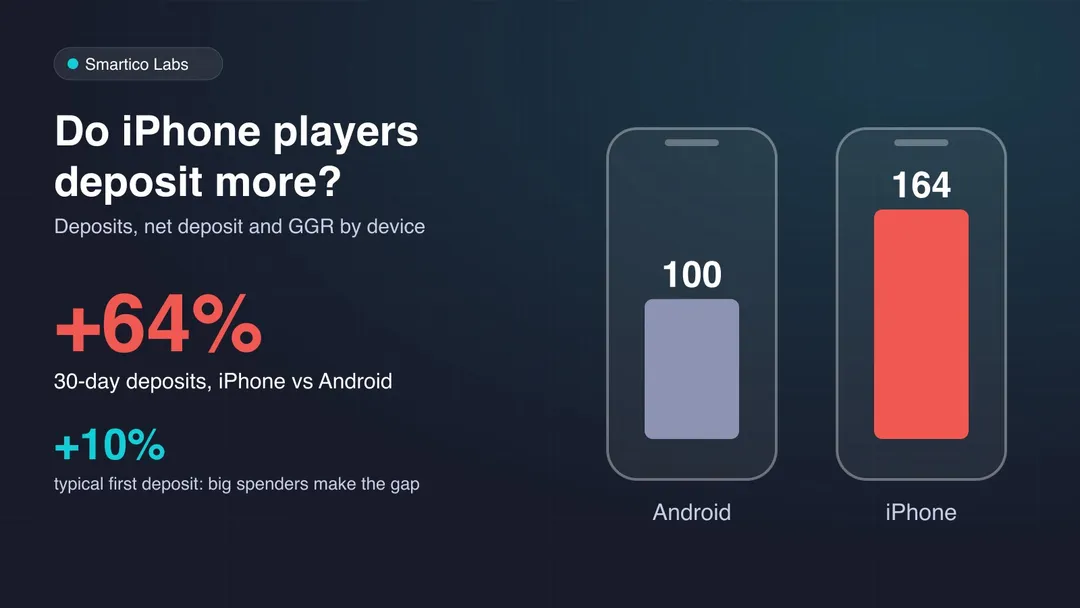
Do iPhone users spend more? In the same casino and country, iPhone players deposit 64% more than Android players. Deposits, net deposit and GGR by device.
Why we looked
Most CRM teams split players by country, VIP level, favourite game or last deposit. One thing is almost always missing: the device. It is known from the first session. It costs nothing to read. Yet few teams use it.
The common belief is that "Apple users spend more". We wanted to see if it is true for casino players, how big the gap is, and what it does to the numbers that matter: deposits, withdrawals, net deposit and GGR.
How we tested it
- We took players who made their first deposit between May and August 2026, in many casinos and sportsbooks.
- We followed each player for 30 days from the first deposit: deposits, withdrawals, net deposit (deposits minus withdrawals) and GGR (bets minus wins).
- We compared devices inside the same brand, so currency, games and bonuses are the same. Then we repeated the test inside the same brand and the same country, to take the country out of the picture.
- "Mobile web" means the casino site opened in a phone browser. Most players play this way. For each comparison we report the median brand, so a few large brands cannot decide the result.
iPhone players deposit more
Read the grey bars first. The typical iPhone player deposits only a little more than the typical Android player: about 10% on the first deposit and 25% over 30 days.
Now the teal and coral bars. The average iPhone player deposits 64% more. Why the difference? Because the average is pulled up by big spenders, and iPhone has more of them. Even at the edge of the top tenth of spenders, iPhone players deposit about 50% more than Android players.
iPhone players also withdraw more (about 70% more on average). But they keep the same share of what they deposit, so the advantage stays in the money that counts: net deposit +61%, GGR +51%.
Put it in plain numbers. At the median casino, iPhone players are about a third of the new mobile-web players, but they bring close to half of the mobile-web deposit money.
It is not the country
Phones are not spread evenly. iPhones are more common in richer countries, so a simple comparison could just be measuring wealth. That is why we compared players in the same casino and the same country.
Across about 700 casino-and-country pairs in 129 countries, iPhone players deposited 45% more on average, and the iPhone side was ahead in 4 pairs out of 5.
The size of the gap changes by market. The chart shows the three largest and the three smallest gaps: for example about 2x in the US and Mexico, and none in Italy and Finland. Most other markets sit in between, at +20% to +70%.
The iPhone premium is a real difference between players, but it is not a fixed number. Check it for your own markets before you build offers on it.
Desktop: big deposits, big withdrawals
Desktop players are a small group (8% of new players at the median casino). They start bigger: the average first deposit of a Windows desktop player is about 2.5x that of an Android mobile-web player.
Look at the bars again. Deposits are 1.9x, but withdrawals are 2.2x. Four players out of ten on desktop withdraw within 30 days, against three out of ten on mobile. So the net deposit gap shrinks to +25%.
The result: desktop is 12% of deposits, but only 8% of net deposit. Its share of net money is the same as its share of players.
This is the number to remember. Here is how to read it: take 100 deposited by a group of players, then take off everything that group withdrew in the same 30 days. What is left is the net deposit. For Windows desktop players it is 20. For iPhone and Android players on mobile it is 32. For Mac desktop players it is 34: they deposit the same as Windows players, but they withdraw less of it.
The browser tells you something too
Inside the same device and operating system, the browser separates players. On iPhone, players who browse with Chrome instead of Safari deposit 87% more, in 8 casinos out of 10. They also withdraw more (13 points more players cash out), but their net deposit stays about 2x that of Safari players.
On Windows, Chrome beats Edge (-16%) and Firefox (-21%).
These are patterns, not causes. A player who installs another browser on an iPhone made a choice, and that choice often goes with higher engagement. For CRM, the cause matters less than the fact that the signal is free and easy to read.
What this means for operators
- Do not treat all phones the same. iPhone and Android players look alike at the median, but the average is very different. The extra money sits in a smaller group you can find.
- Look at net deposit, not only deposits. Desktop looks like the best segment on deposits and falls back to the middle on net deposit.
- Check your own markets. The iPhone premium is about 2x in some countries and zero in others.
- Read the device from the first session. It is in the player profile from day one, long before a VIP score or a deposit history exists.
How to use it: cases for CRM and gamification
The cases below turn the findings into actions. The benefit figures are modeled from this study, not measured in a live test. The scenarios use the median casino: Android mobile web is about 55% of new players and about 47% of their deposit money; iPhone is about 31% of players; desktop is about 8% of players and 12% of deposit money.
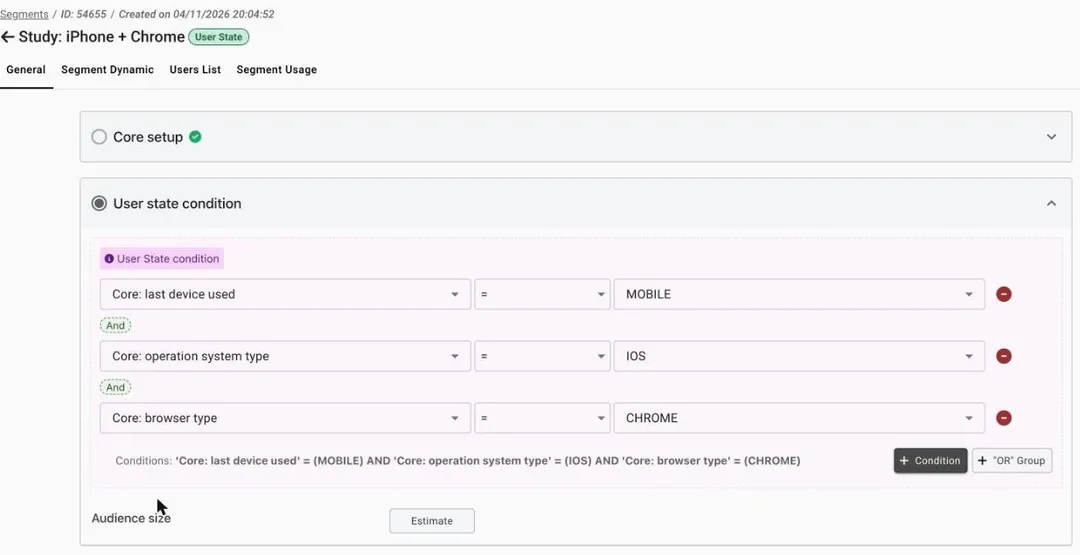
1. Start the VIP clock earlier on iPhone, and on iPhone with Chrome.
- Signal: iPhone players deposit 64% more on average, and Chrome-on-iPhone players 87% more than Safari players.
- Action: build a segment on device, operating system and browser. Add the new-depositor VIP score. Send these players to a VIP manager or a higher offer tier in the first week.
- Modeled benefit: if the fast track lifts the 30-day deposits of iPhone players by 5%, that is about +5% deposits, net deposit and GGR on the iPhone segment. It is about +2.4% on all mobile-web deposits.
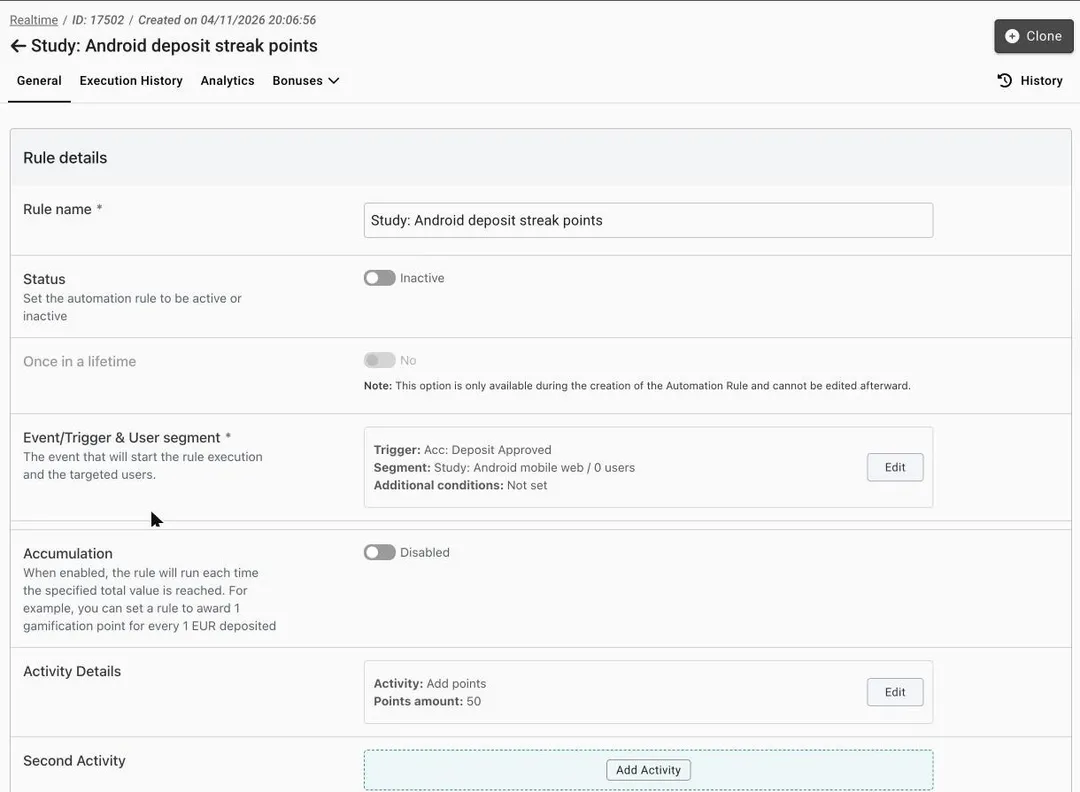
2. Close part of the Android gap with gamification.
- Signal: Android players are the largest group, and they deposit 39% less on average than iPhone players in the same casino.
- Action: give Android mobile-web players deposit missions, a visible level path and tournament entries in the first 30 days. Keep a control group of the same size without them.
- Modeled benefit: if the program closes only 10% of the gap, Android deposits rise about 6.4%. Because the keep rate is the same as on iPhone (32 per 100), net deposit moves by about the same, and GGR by about 6%. That is roughly +3% on all new-player deposits of the casino.
3. Protect the desktop balance.
- Signal: Windows desktop players keep 20 per 100 deposited, mobile players 32, Mac desktop players 34.
- Action: when a desktop player asks for a withdrawal, show a reward for staying and playing (a mission, a level step, a tournament seat). Do it inside your licence and responsible-gambling rules: never block or slow a withdrawal.
- Modeled benefit: if the keep rate on desktop rises by 6 points (half the gap to mobile), desktop net deposit grows by about 30%. Desktop is 12% of deposit money, so that is about +2% of total new-player net deposit, before the cost of the reward.
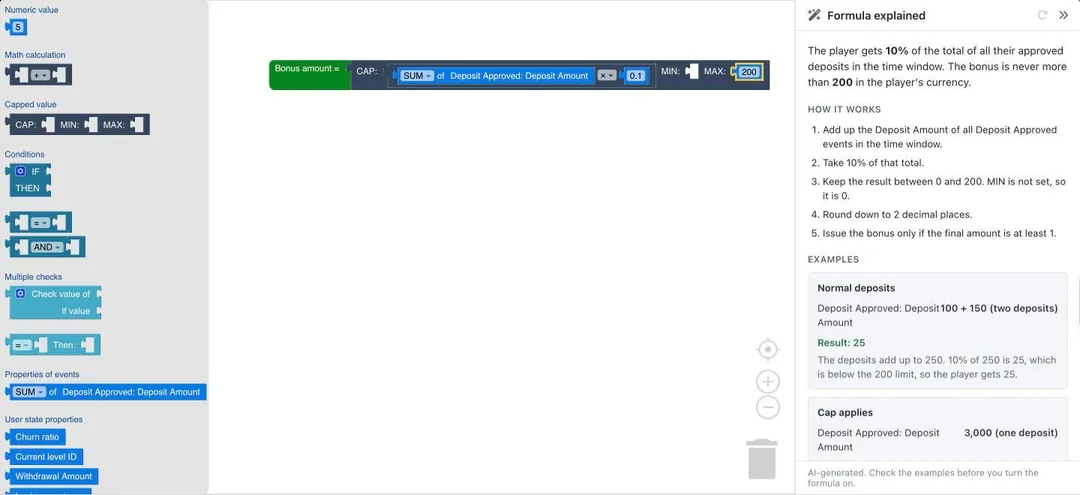
4. Match the offer size to the device value (NGR).
- Signal: a bonus of the same percent costs about 1.6x more per iPhone player, because deposits are 1.6x bigger.
- Action: tier or cap the bonus by player value, using the device as one of the first signals. Keep generous entry offers where the typical player is small, and caps or tiers where the tail is big. In the back office this is one bonus formula per value group, each attached to a rule for its segment (see the back-office screenshots below).
- Benefit: NGR is GGR minus bonus cost. We did not measure bonus cost in this study, so we show GGR and net deposit. The logic is simple: the same GGR with a smaller bonus bill is more NGR.
5. Choose the channel by device.
- Signal: iPhone players are the higher-value group, and web push permission can be harder to get on iPhone.
- Action: use on-site banners and popups at login for iPhone web players, and ask for push permission at the right moment (our push permission study shows how).
- Benefit: the aim is reach among the players who matter most. We did not measure this one.
Always test it. Keep a holdout group inside each device segment, so the lift you report is the lift you caused.
See it in the back office
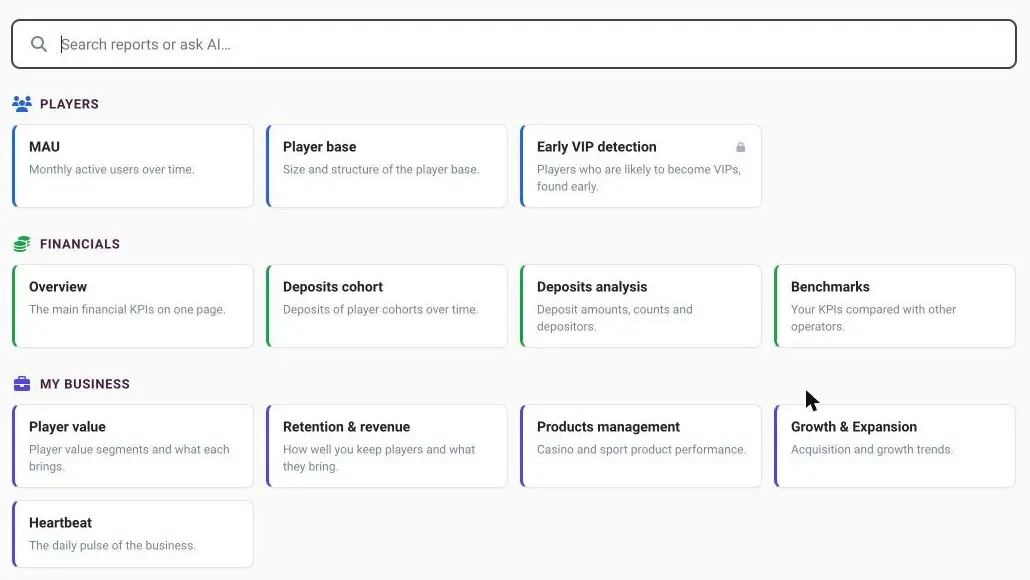
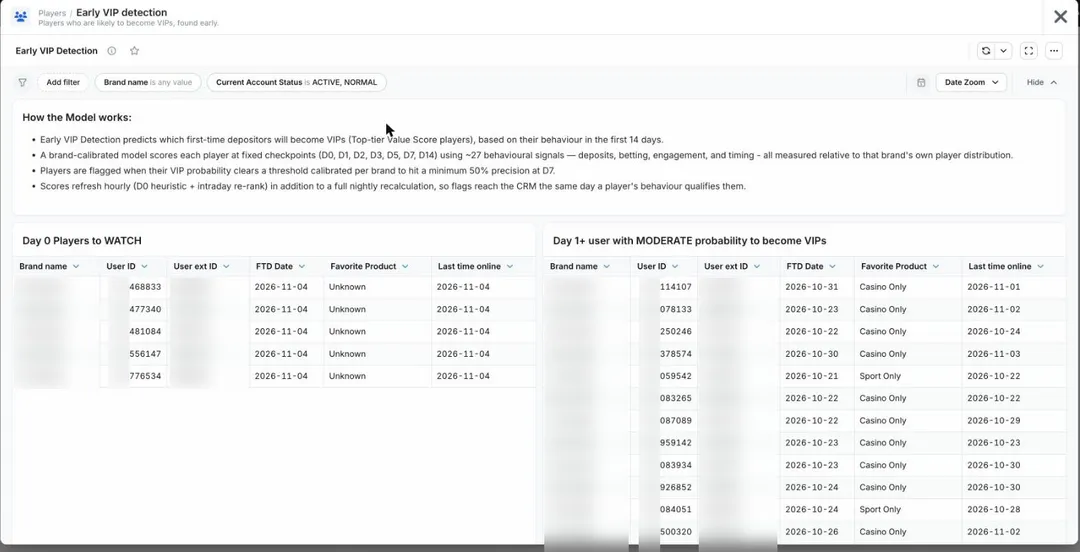
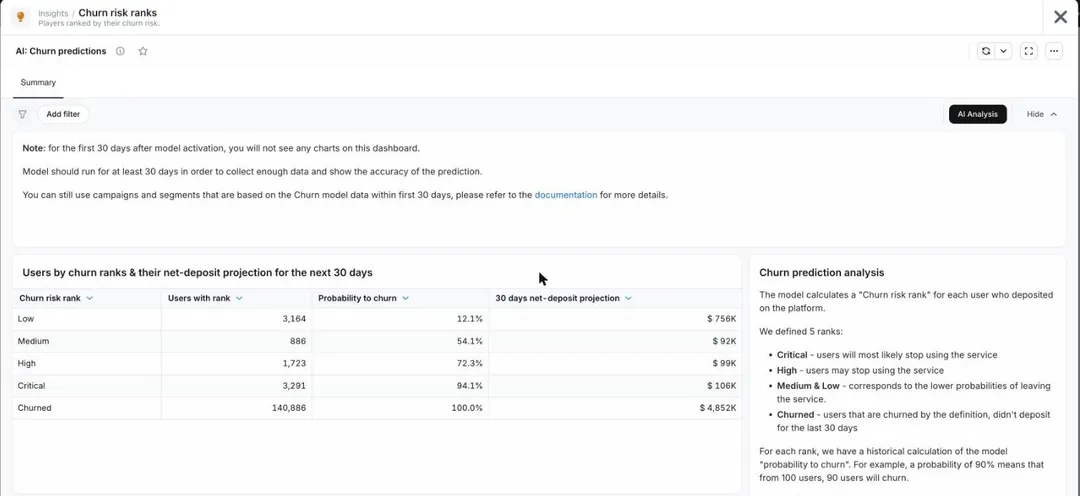
Here is how the cases look in Smartico. Use the arrows to move through the screenshots, and click one to zoom in. The first four are from a demo account with no real players, so the segment sizes show 0. The last two are real reports from a live account, with the brand name and player IDs blurred.
Do it in Smartico
All three signals in this study (device, operating system and browser) are part of the player profile in Smartico. You can use them in the same places as any other player property.
- Segments group players by device, operating system and browser, together with country, deposits and VIP score.
- CRM automation and campaigns start a journey when a player of that segment makes a first deposit, asks for a withdrawal or goes quiet.
- Missions and the rest of gamification give Android players goals to reach, and desktop players a reason to stay.
- Early VIP Detection and Churn & LTV Prediction add a score to the device signal, so your team acts on both.
- The Bonus Engine gives rewards in real time, tailored to player behavior.
Want to see your own numbers? Smartico can run the same device cut on your players. Request a demo.
FAQ
Do iPhone users spend more than Android users?
Yes, on average. In the same casino, iPhone players on mobile web deposited 64% more than Android players in their first 30 days, with 51% more GGR and 61% more net deposit. The typical player is much closer: the first deposit differs by about 10%. Big spenders drive the gap.
Do iPhone users deposit more because they live in richer countries?
No. Inside the same casino and the same country, iPhone players still deposited 45% more, and were ahead in 4 casino-and-country pairs out of 5. The size depends on the market: for example about 2x in the US and Mexico, and close to zero in Italy and Finland.
Do desktop players deposit more than mobile players?
Yes, but they keep less. Windows desktop players deposit about 1.9x more than Android mobile players, but they withdraw 2.2x more. After 30 days, of every 100 they deposit only 20 are still net (the rest was withdrawn), against 32 on mobile. Desktop is 12% of deposits and only 8% of net deposit.
What is net deposit and why does it matter more than deposits?
Net deposit is deposits minus withdrawals. It shows what stays with the operator after players cash out. Two groups can deposit the same and still differ: Mac and Windows desktop players deposit alike, yet Mac players are left with 34 per 100 deposited and Windows players with 20.
Data and method
- Data. Smartico player data from production casinos and sportsbooks. Players made their first deposit between May and August 2026, which gives tens of millions of players, followed for 30 days from the first deposit.
Show the full methodHide the full method
- Device. Device type, operating system and browser are those of the player's latest session. We use a recent group of first-time depositors, so the latest device is close to the device used around the first deposit.
- Money. Deposits, withdrawals and GGR in each casino's own currency, so no exchange rates are needed. Net deposit is deposits minus withdrawals. GGR is casino bets minus casino wins plus sport bets minus settled sport wins.
- Comparison. Groups are compared inside the same brand (and, for the country test, inside the same brand and country, with at least 100 players per group). We report the median brand of each ratio. "Typical" is the median player, "average" the mean.
- Browsers. Compared with the most common browser on the same device and operating system.
- Quality filters. Players whose first deposit does not match their first deposit record within 36 hours are left out, as are brands with too few deposit records.
- Limits. These are patterns, not causes: iPhone and Android players may also differ in age, income and in how they found the casino. The device is the latest one, not always the device at the first deposit. The sport side of GGR is approximate, because bets and settlements are booked on different days. Scenario benefits in the cases are modeled from these ratios, not measured in a live test.
- Privacy. We report shares and ratios only. No brand or player is named.
How to cite
Smartico (2026). iPhone vs Android players: iPhone players deposit 64% more. https://www.smartico.ai/resources/labs/iphone-vs-android-users
The device, operating system and browser signals are available in Smartico segments and in every journey, mission and bonus rule.
More from Smartico Labs
 Data study
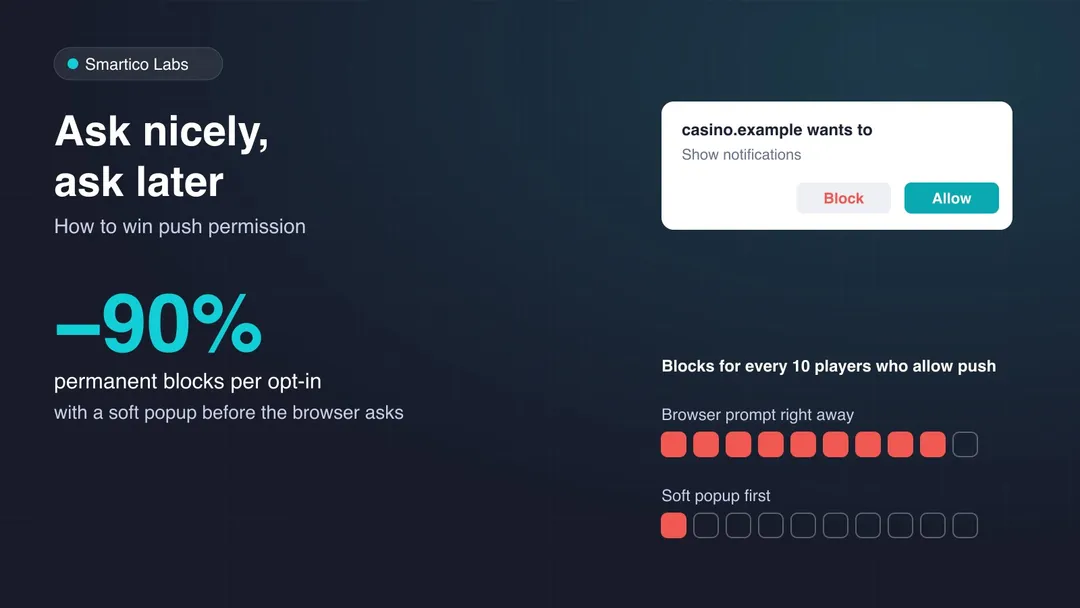
Ask Nicely, Ask Later: How to Win Push Permission Without Losing Players for Good
Asking for push permission straight away loses about one player for good per opt-in. A soft popup first cuts those losses by 90%. Data from tens of millions of casino players.
 Data study
Same Message, Better Hour: AI Send Times Lift Push Clicks by 38%
Send time optimization tested on casino players: a push sent in the player's own AI-predicted best hour got 38% more clicks. Someone else's best hour did almost nothing.
 AI
Machines Read, People Decide: What 865,000 AI Agent Calls Show About Casino CRM
Four months of AI agents working inside a casino CRM: 30 times more brands, whole journeys built from one message, and why people still make 78% of the changes.
Try what we build
Much of our R&D is open to try: a demo casino, games made in Vibe Studio and the code we publish.